Explainer: Leading vs. Lagging Indicators in Market Trend Analysis
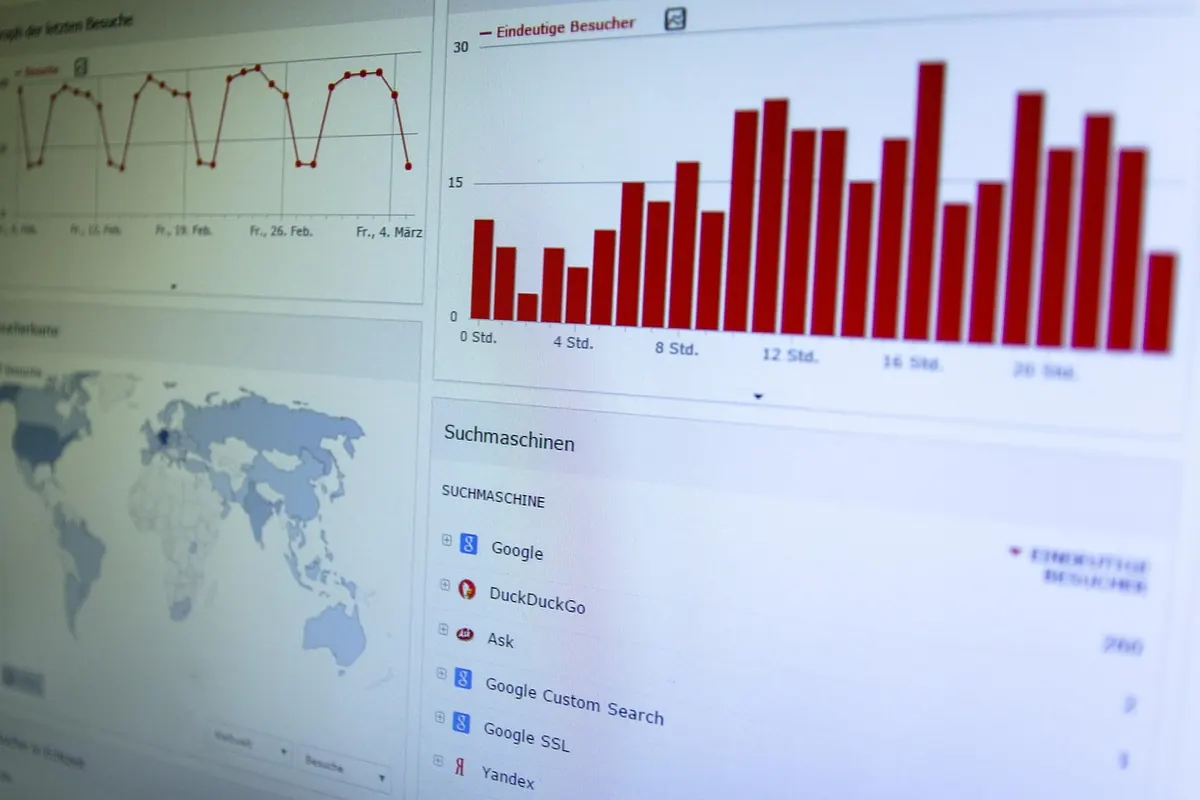
Markets rarely switch direction with a clean announcement. A trend usually begins as a small divergence—a few more new orders, a wider credit spread, a weakening breadth reading—before the headline data catch up. That gap between the first hint and the confirmed outcome is where leading and lagging indicators do different jobs. Confusing the two is one of the most common reasons market timing feels harder than it needs to be. The goal is not to find a single perfect signal, but to understand which data are trying to warn you and which are trying to confirm what has already happened.
The Core Difference: Timing Versus Confirmation
A leading indicator changes before the economy or market trend it is meant to signal. It is an early-warning device: useful for attention, not proof. A lagging indicator changes after the trend has formed. It is the receipt, not the forecast. A rise in jobless claims may hint that hiring is cooling; a rise in the unemployment rate shows that the cooling has become visible in the official labor data. The first can prompt a question. The second answers it.
The distinction matters because the two answer different questions. Leading data asks, “Is the odds of a shift rising?” Lagging data asks, “Did the shift actually happen?” Market analysis needs both questions. If you only watch leading indicators, you spend too much time reacting to noise. If you only watch lagging indicators, you arrive after the move has already been priced.
Coincident indicators, such as industrial production or real income, describe current conditions. They are useful context, but they rarely give an edge in timing. The practical work sits at the two ends: anticipation and confirmation. A well-built process uses leading data to prepare and lagging data to verify, rather than asking either one to do the whole job.
Leading Indicators: Early Warnings That Deserve Attention
Leading indicators are not crystal balls. They are pressure gauges. They tell you where to look, which questions to ask, and when to tighten risk. Common examples include new orders in purchasing-manager surveys, building permits, initial jobless claims, credit spreads, inventory-to-sales ratios, and earnings revisions. In market analysis, breadth measures, relative strength, volatility term structure, and sentiment extremes can play a similar role, though each has its own quirks.
- New orders: a drop in orders can appear before production and sales weaken. Watch the direction over several releases, not a single print. A one-month dip may be noise; a steady decline across three or four reports is a more meaningful pattern.
- Initial jobless claims: a sustained rise often shows up before the unemployment rate turns. One noisy week is rarely enough. The four-week average exists for a reason: it smooths seasonal and temporary distortions.
- Credit spreads: widening spreads can signal stress before equity prices fully reflect it. Narrowing spreads can do the opposite. Because credit markets are sensitive to refinancing risk and default expectations, they often move ahead of slower-moving economic data.
- Inventory-to-sales: rising inventory relative to sales can hint at future cutbacks in production. If goods are piling up on shelves or in warehouses, companies may reduce orders before the weakness appears in headline sales.
- Market breadth: fewer stocks participating in an advance can warn that a trend is narrowing, even while the index is still rising. A handful of large names can keep an index aloft while the average stock stalls.
- Earnings revisions: analysts often cut estimates before reported profits fall. A broad shift from upgrades to downgrades can be an early sign that expectations are too high.
What Makes a Leading Signal Useful
A useful leading indicator has an economic or behavioral reason to move first. It is published often enough to matter, revised without changing the story every month, and noisy enough that you need a rule for interpreting it. That rule might be a three-month moving average, a threshold, or a requirement that two independent signals agree. Without a rule, you will see what you want to see. With a rule, you can distinguish a genuine shift in pressure from the normal churn of a volatile series.
The best leading indicators are also specific about what they are leading. A widening credit spread is not a generic recession alarm; it is information about stress in credit markets. A decline in building permits is not a broad market forecast; it is a signal about future construction activity. The more precise the economic link, the more useful the signal.
Lagging Indicators: Confirmation, Not Prophecy
Lagging indicators tell you what has already happened. Unemployment, GDP growth, inflation, corporate profits, and reported sales are familiar examples. In price analysis, a long moving average or a confirmed break of a trendline is also lagging by design. It waits for price to prove itself. That is why a lagging indicator can feel frustrating in real time: it often turns after the opportunity appears to have passed.
That delay is not a flaw. It is a filter. Lagging indicators help you avoid overreacting to every flicker in leading data. They confirm whether a shift has spread from a niche signal into the broader system. They also help with risk management: once a trend is confirmed, you can size positions and set invalidation levels with more confidence.
Where Lagging Indicators Earn Their Keep
Lagging data separates a genuine regime change from a false start, gives you a common language for reviewing performance, and keeps a disciplined investor honest when a leading signal is early or wrong. Use lagging data as confirmation, not as a trigger that promises perfect entry. For example, a rising unemployment rate may confirm that a slowdown has moved beyond survey data. A confirmed break of a long-term moving average may confirm that a price trend has changed, even if it does not identify the exact top or bottom.
Lagging indicators are also useful for post-mortems. After a trade or a market call, they help you ask whether the thesis was supported by actual outcomes, not just by the signals that first caught your attention. That review process is how an indicator dashboard improves over time.
Why One Without the Other Misleads
Most timing errors come from asking one type of indicator to do the other’s job. A leading indicator used as proof produces whipsaws. A lagging indicator used as a forecast produces late entries and exits. The solution is not to pick a side. It is to build a sequence.
Consider a simple macro example. Credit spreads widen and new orders soften. Those leading signals put a recession watch on the desk. They do not justify a full portfolio shift by themselves. If unemployment later rises and sales revisions turn negative, the lagging data confirms that weakness has moved through the system. The leading signal gave you time to prepare; the lagging signal gave you evidence to act with size.
Leading indicators are questions. Lagging indicators are answers that arrive after the test.
For market timing, use leading indicators to build a watchlist, define risk, and prepare conditional plans. Use lagging indicators to confirm the regime, justify larger commitments, and review whether the thesis held. The discipline is in the sequence: observe, prepare, confirm, act. Skipping the middle steps is what turns a useful signal into a source of frustration.
A Practical Workflow for Combining Both
A simple workflow can keep the two types of indicators from blurring together. The aim is not to predict every turn, but to respond with proportion: small actions on early evidence, larger actions on confirmation.
- Select a small set of leading indicators. Choose signals with a clear economic or behavioral rationale, such as credit spreads, new orders, claims, breadth, and earnings revisions. Fewer, better-understood indicators are more useful than a crowded dashboard.
- Define rules before the data arrive. Decide what counts as a meaningful move: a three-month trend, a threshold breach, or agreement across two independent signals. Write the rule down so you cannot move the goalposts after the fact.
- Translate early signals into scenarios. If credit spreads widen and breadth deteriorates, what would you do? Trim risk, hedge, raise cash, or simply watch more closely? The leading signal should prepare a decision, not force one.
- Wait for lagging confirmation before sizing up. Use confirmed price trends, reported earnings, unemployment data, or other slower measures to decide whether the shift is real enough to justify a larger position.
- Review the sequence afterward. Did the leading signal precede the lagging confirmation? Was the lag useful or excessive? Did the rule reduce noise, or did it create false confidence? Adjust the process, not just the forecast.
Common Pitfalls in Indicator Analysis
Even a sound framework can fail if the indicators are used carelessly. Several pitfalls deserve particular attention.
- Treating a single print as a trend. Most leading series are noisy. One weak report is a data point; a sustained change is a signal.
- Ignoring revisions. Some indicators are revised heavily. A signal that depends on the first estimate may disappear later.
- Overfitting to the last cycle. The indicator that warned early in one downturn may lag in the next. Economic structure and market composition change.
- Confusing direction with magnitude. A leading indicator can be right about direction but useless about the size or timing of the move.
- Watching too many signals. A dashboard with dozens of indicators invites contradiction and hindsight. A focused set with clear rules is more actionable.
The practical takeaway is to treat leading and lagging indicators as partners in a process, not rivals in a forecasting contest. Leading data helps you pay attention early. Lagging data helps you avoid acting on every false alarm. Used together, they make market trend analysis more disciplined, more transparent, and less dependent on the hope that one perfect signal will arrive before the crowd.
Photo: benjaminhartwich / Pixabay